
Gone are the days when we feared stack buffer overflows, as most modern compilers deploy stack protection by default (we all like cookies, right?), but for the sake of getting myself familiar with WinDbg debugger extension development I decided to have some fun and try to write a small SBOF detection script. But before delving into Javascript coding (not my cup of tea to be honest), we need to know how WinDbg native objects are exposed to scripting providers and how that works in general.
For a long time, WinDbg was considered somewhat obscure debugger used mainly by Windows kernel developers, testers and rootkit hunters. There are many reasons for such perception, but main ones are related to steep learning curve, lack of proper and modern scripting engine (MASM?!) and poor and non-intuitive UI. Nevertheless, WinDbg was, and still is, one of the most powerful debuggers for Windows platform and practically the only one that can run down the kernel rabbit holes. With the release of WinDbg Preview in 2017 (as opposed to WinDbg Classic which is still available), many goodies came along such as refreshed, ribbon-based UI, easy-to-manipulate debugger data model and Javascript-based scripting provider. Oh, and did I mention Time Travel Debugging? For reverse engineers it can’t get better than that! For me, enough to like it to the point of pinning it to the taskbar 🙂
Back to our little exercise, we will start with very short C program exposing classic stack buffer overflow (bof.c) by using unsafe string copy function for out-of-bound writing to 10-byte buff:
#include <stdio.h>
#include <string.h>

int main(int argc, char *argv[])
{
    char buff[10];
    char *src_buff = "AAAAAAAAAAAAAAAAAAAAAAAAAAAAAAAAAAAAAAA";
    strcpy(buff, src_buff);

    return 0;
}
Bear in mind that if we wish to get rid of stack cookies in Microsoft Visual C++ compiler, we need to specify /GS- as cl.exe command argument which is turned on by default:
cl.exe /Zi /GS- bof.c
and we should end up with bof.exe ready to be loaded into debugger. We previously mentioned that WinDbg exposes objects that we can manipulate, but how to we know which objects are at our disposal? Here comes dx (Display NatVis Expression) command that we can use, for example, to show objects available in the Debugger namespace:
0:000> dx Debugger
Debugger
    Sessions
    Settings
    State
    Utility
    LastEvent
Each of those top-level objects have their own sub-objects (and properties), thus creating a hierarchy of WinDbg data model. Additionally, debugger automatically creates so-called pseudo registers, variables that holds certain values that are useful for everyday tasks. One of those is $peb, which holds the address of the process environment block (PEB) of the current process. If we want to check if the process is being debugged we would refer to BeingDebugged member of PEB struct (offset 0x2) with
0:000> dx @$peb->BeingDebugged.ToDisplayString()
@$peb->BeingDebugged.ToDisplayString() : 0x1
    Length           : 0x3
As expected, it holds a value of 0x1 (true).
Now that we have our target, and we know a little bit about exposed objects and how they’re organized, let’s delve into basics of WinDbg scripting.
Before we even start to think about writing our Javascript code, we need to check if our scripting provider is loaded and ready to use. We do that with .scriptproviders command in WinDbg command window:
0:000> .scriptproviders
Available Script Providers:
    NatVis (extension '.NatVis')
    JavaScript (extension '.js')
As we can see, Javascript provider is loaded. Other useful commands for scripting are:
| Command | parameters |
|---|---|
.scriptload ScriptFile | ScriptFileSpecifies the name of the script file to load. ScriptFile should include the .js file name extension. Absolute or relative paths can be used. Relative paths are relative to the directory that you started the debugger in. File paths containing spaces are not supported. |
.scriptrun ScriptFile | ScriptFileSpecifies the name of the script file to load and execute. ScriptFile should include the .js file name extension. Absolute or relative paths can be used. Relative paths are relative to the directory that you started the debugger in. File paths containing spaces are not supported. |
.scriptunload ScriptFile | ScriptFileSpecifies the name of the script file to unload. ScriptFile should include the .js file name extension. Absolute or relative paths can be used. Relative paths are relative to the directory that you started the debugger in. File paths containing spaces are not supported. |
.scriptlist | None |
When WinDbg script provider loads a script, it first loads it’s root content and then looks for initializeScript() method which can serve as a preparation point for the execution. Execution starts with invokeScript(), and this is the main method of the script. Difference between the two is that initializeScript() gets executed when .scriptload is called, while .scriptrun executes both initializeScript() and invokeScript() (in that order).
Let’s write a super simple HelloWorld script (note how model is exposed with root host object):
"use strict";

function initializeScript()
{
    host.diagnostics.debugLog("Loaded.\n");
}

function invokeScript()
{
    host.diagnostics.debugLog("Hello, World!\n");
}
and run it with
0:000> .scriptrun c:\\windbg\\helloworld.js
Loaded.
JavaScript script successfully loaded from 'c:\windbg\helloworld.js'
Hello, World!
Cool.
Knowing how to write and run a script in WinDbg, ler’s for a moment think what is our goal here:
- Set a breakpoint at function in which suspicious code resides
- We need to find a way to check if, during the execution of code, current call stack pointer value changes (gets overwritten)
- If 2, halt the execution and inform the user that stack buffer overflow occurred.
So we need to write a script that will be executed when first breakpoint is hit, and that script would arrange monitoring of @$csp (yes, pseudo register that corresponds to FrameOffset property of @$curthread.Stack.Frames[0].Attributes object) in a way that if its value changes, halt the execution and inform about detection. How? By setting up another, this time conditional breakpoint on @$csp that gets hit when something is written to it (basically, it is stack cookie without comparison before the ret). It’s time to write that down:
"use strict";

const log   = e => host.diagnostics.debugLog("[DBOF] " + e);
const logln = e => log(e + '\n');
const hex   = e => '0x' + e .toString(16);

let __getFrameOffset = function()
{
    let ret = host.currentThread.Stack.Frames[0].Attributes.FrameOffset;
    return ret;
}

let __getRetAddr = function()
{
    let ret = host.currentThread.Stack.Frames[0].Attributes.ReturnOffset;
    return ret;
};
function uninitializeScript()
{
    ctl = host.Debugger.Utility.Control;
    ctl.ExecuteCommand("bc @$csp");
}

function initializeScript()
{
    logln("DBOF loaded.");

    return [
        new host.functionAlias(__getFrameOffset, "dbof_gfo"),
        new host.functionAlias(__getRetAddr, "dbof_gra"),
    ];
}

function invokeScript()
{
    let retOffset = __getRetAddr();
    let frmOffset = __getFrameOffset();
    logln("Stack buffer overflow check");
    logln("=========================================");
    logln("ReturnOffset: " + hex(retOffset) + " FrameOffset: " + hex(frmOffset));
    let ctl = host.namespace.Debugger.Utility.Control;
    let bofbp = ctl.SetBreakpointForReadWrite(frmOffset, "w", 8);
    bofbp.Command = ".echo [!] BUFFER OVERFLOW DETECTED!"
    logln("Frame exit BOF check breakpoint set.");
and voila! We have our dbof.js script ready to catch those nasty BOFs and its pretty self-explanatory. One notable method is SetBreakpointForReadWrite:
SetBreakpointForReadWrite(address, (opt) type, (opt) size) | Method which sets a breakpoint on read/write (default) at a certain address and returns it as an object in order to be able to control its options |
Also, we exposed two new handy commands that we can use – !dbof_gfo (return FrameOffset) and !dbof_gra (return ReturnOffset).
Let’s test our script by launching an executable (bof.exe) in WinDbg. After initial break, we can set breakpoint in function bof!main and define the action of running our dbof.js script when it gets hit:
0:000> bp bof!main ".scriptrun c:\\wdbg\\dbof.js"
We can check that breakpoint is set and active:
0:000> bl
     0 e Disable Clear  00007ff7`e2b07140  [C:\Users\srdja\Programming\C\bof\bof.c @ 5]     0001 (0001)  0:**** bof!main ".scriptrun c:\\wdbgdbof.js"
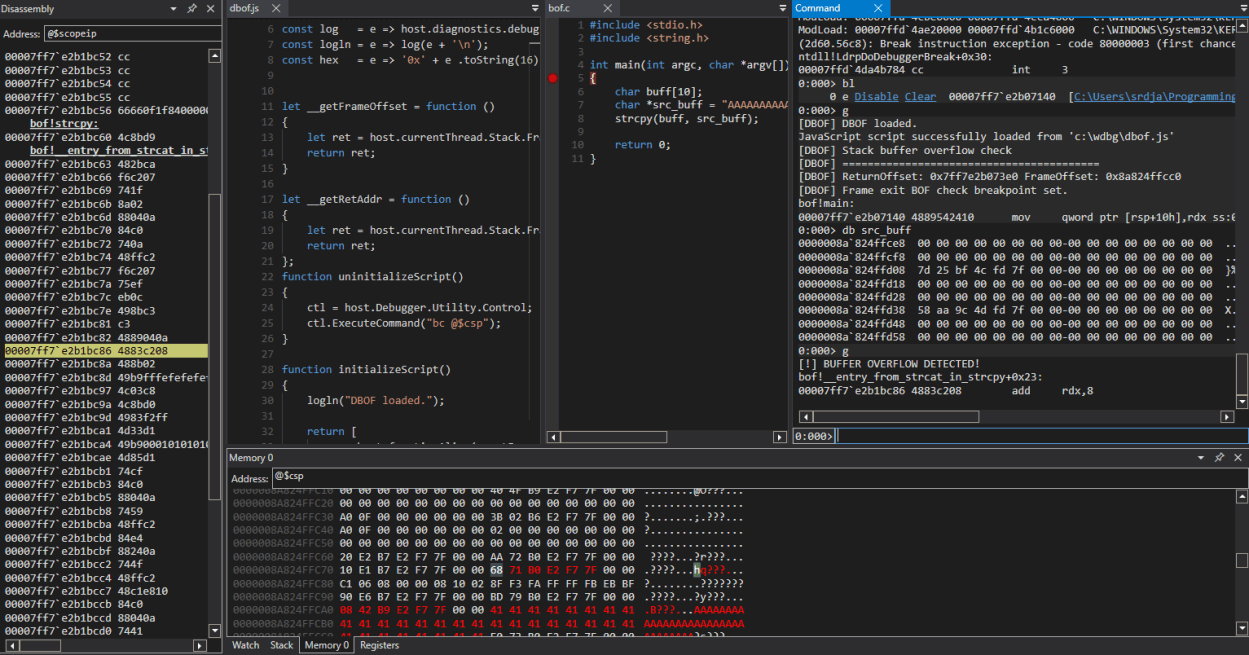
Here is what we see after we have started the execution of our target (with command g):
0:000> g
[DBOF] DBOF loaded.
JavaScript script successfully loaded from 'c:\wdbg\dbof.js'
[DBOF] Stack buffer overflow check
[DBOF] =========================================
[DBOF] ReturnOffset: 0x7ff7e2b073e0 FrameOffset: 0x86ba73fad0
[DBOF] Frame exit BOF check breakpoint set.
bof!main:
00007ff7`e2b07140 4889542410      mov     qword ptr [rsp+10h],rdx ss:00000086`ba73fae8=00007ff7e2b07569
Great! Our breakpoint at bof!main is hit and conditional breakpoint is set on FrameOffset address of 0x86ba73fad0. Now, if buff gets overwritten, we should see BUFFER OVERFLOW DETECTED message and execution should be stopped due to breakpoint #2 hit. Let’s continue:
0:000> g
[!] BUFFER OVERFLOW DETECTED!
bof!__entry_from_strcat_in_strcpy+0x23:
00007ff7`e2b1bc86 4883c208        add     rdx,8
And that is exactly what happened. We can observe that overflow happened during the strcpy call which is what we have expected.
So that’s it for now, and see you in new bit’s’bytes story.
