
As some of you might know, I am recently focusing on ARM64/AArch64 trying to expand my reversing skills to this magnificent realm. As I was dealing exclusively with the x86-64 for the bigger part of my career, I thought that learning about the internals of this widely used RISC platform (somebody argue that it is the architecture of the future) could be fun, but also a challenge. For the past month or so, following my learning path, I got to the stage where I am comfortable enough to read, write and reverse. And what is the best way to prove it to myself? You guessed it – by solving crackmes! (And some malware analysis, but let’s leave it there for now)
ARMsRace is one of those Windows on ARM challenges. Being rated as moderate difficult (3.0), I thought that getting the flag would be an exciting journey. So, without further ado, let’s dive in.

Running the binary got us nowhere as it seems that it keeps getting stuck in an infinite loop of some kind, which is common in these kinds of challenges, and obviously, something that we will have to deal with. Searching for interesting strings, besides usual spills from the compiler, revealed program’s prompts and responses together with the one that looks obfuscated (v6nw6qq5cilb), so we will take note of that.

PE analysis revealed nothing interesting. All usual sections are in place, no high entropy that would indicate packed/encrypted payloads or hidden data. Just plain old ARM64 Portable Executable. It’s time for static analysis.
When there are no symbols provided, finding main can be tricky. What I usually do is that I search for known strings (for example, prompt that I already saw by running the binary) and check its cross references.
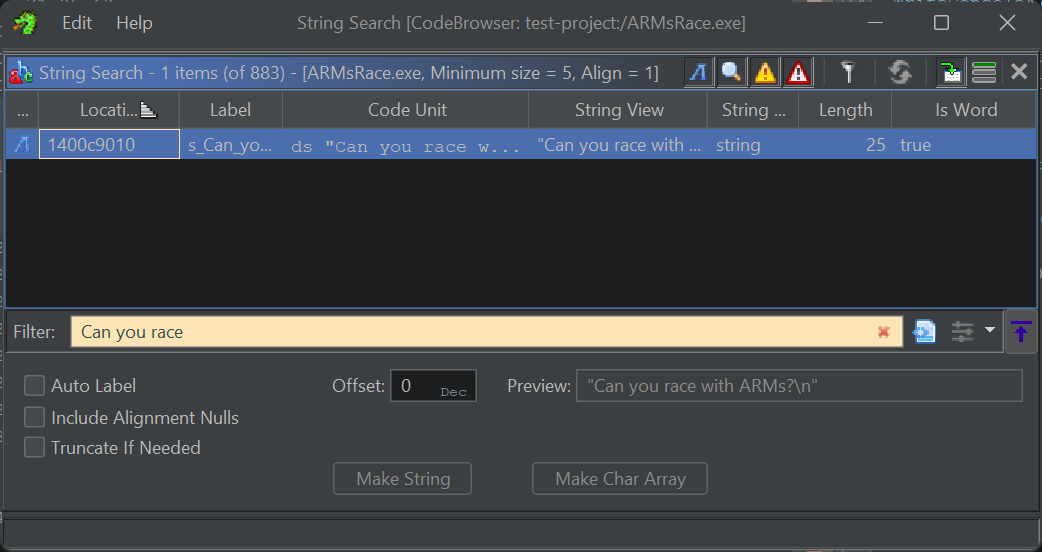
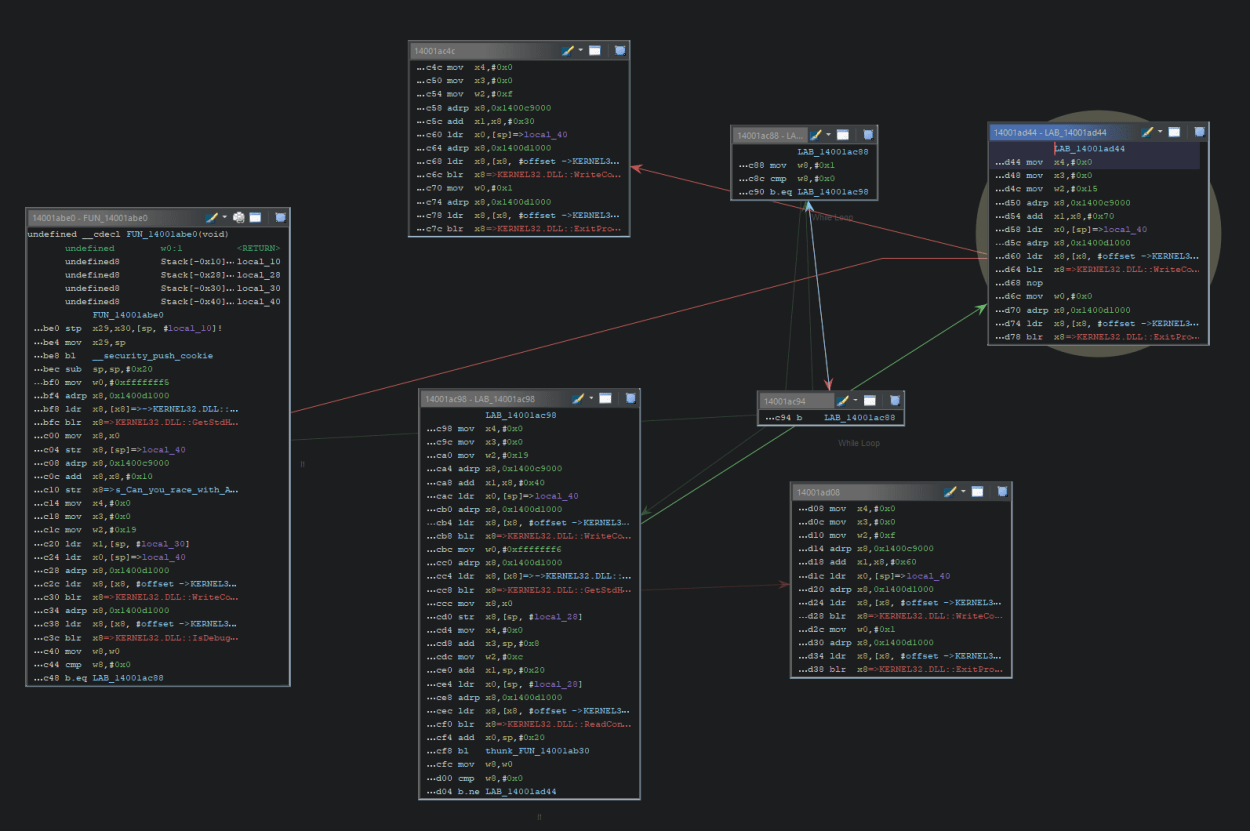
Ghidra reveals that string “Can you race with ARMs?” is being used in function FUN_14001abe0 that looks like this:
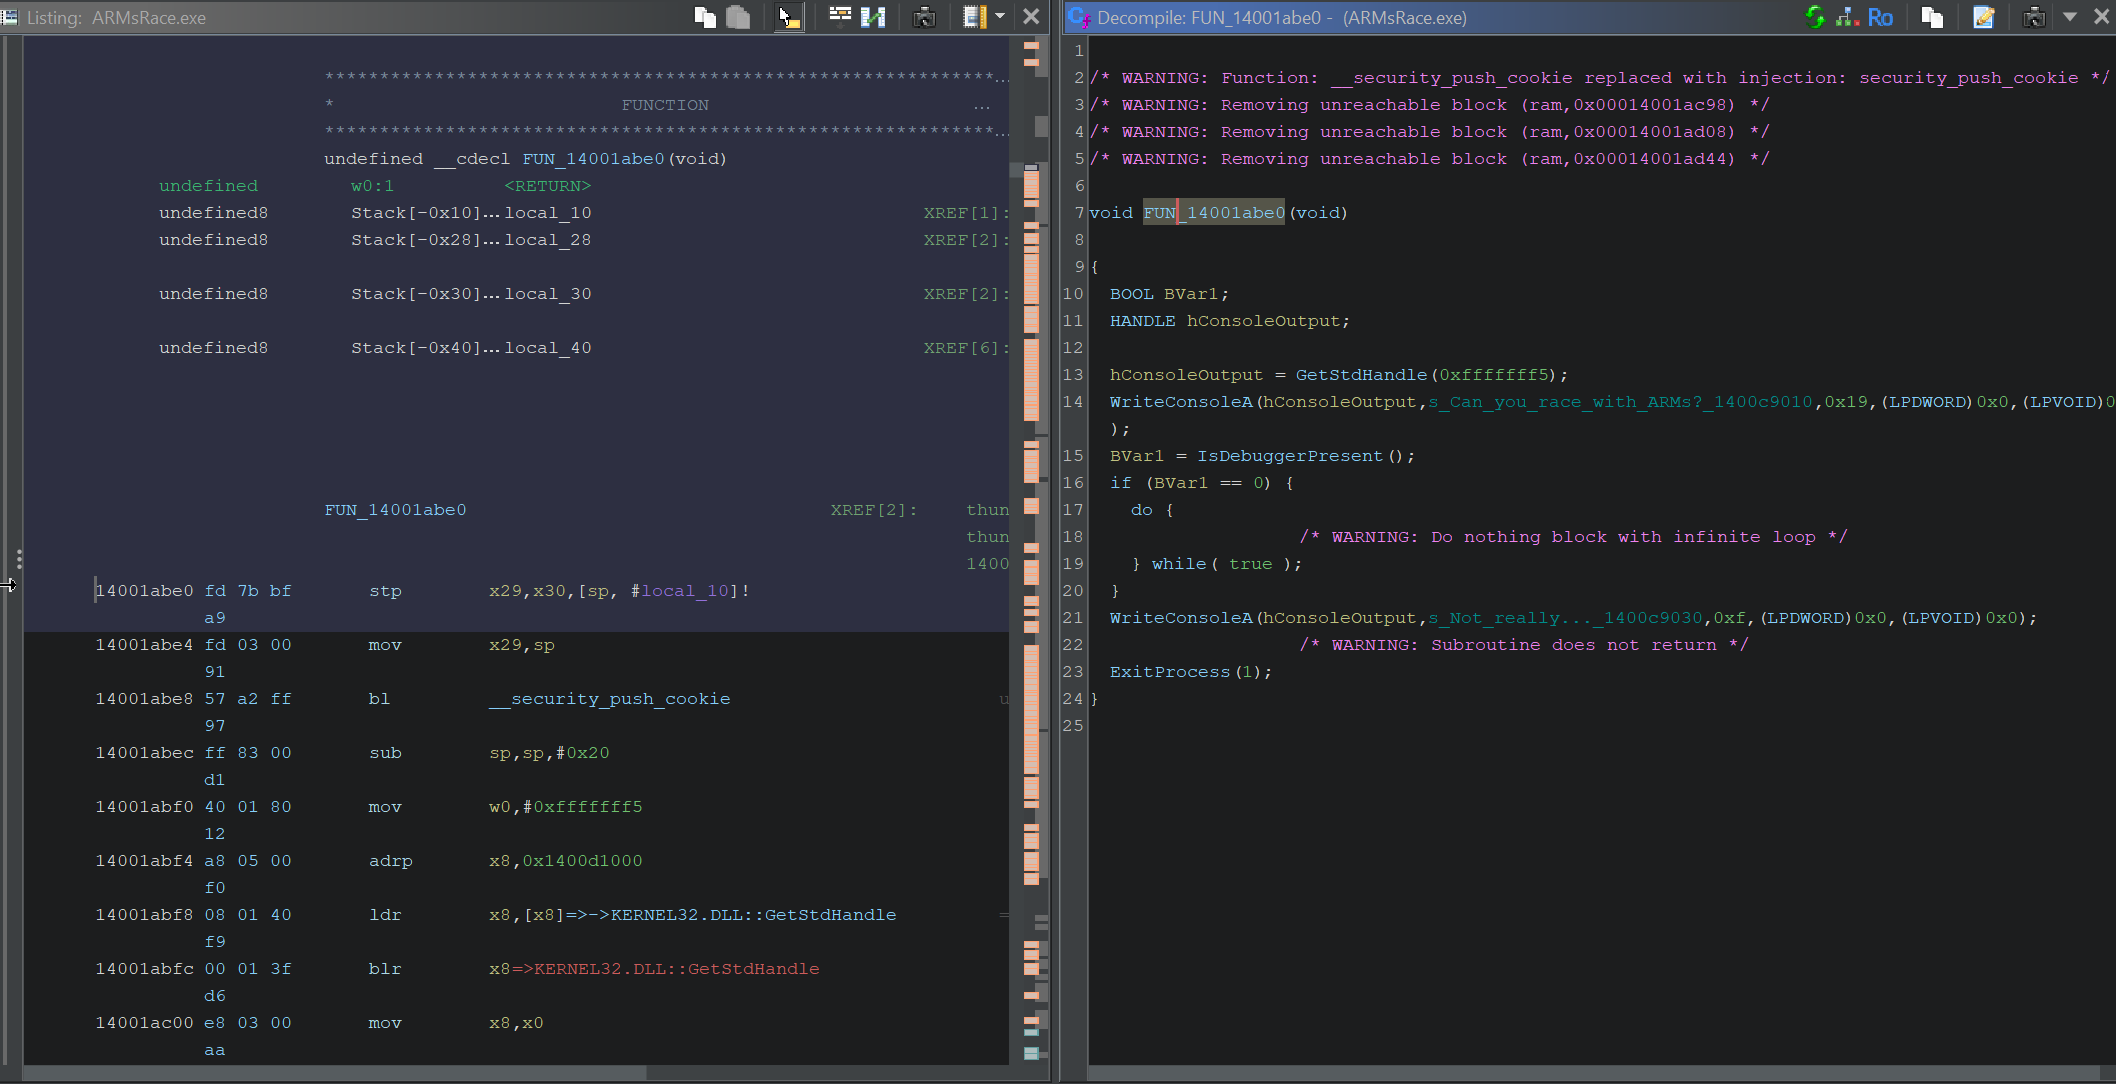
As it contains the call to ExitProcess with exit code 1 (error of some kind), we can safely assume that this is, in fact, main function. Also, we can spot that infinite loop at line 19 of decompiler listing.
Disassembled main also reveals something interesting:
          14001ac34 a8  05  00       adrp       x8 ,0x1400d1000
                 f0
       14001ac38 08  05  40       ldr        x8 ,[x8 , #offset  -> KERNEL32.DLL::IsDebuggerPres  = 000d1728
                 f9
       14001ac3c 00  01  3f       blr        x8 => KERNEL32.DLL::IsDebuggerPresent
                 d6
       14001ac40 e8  03  00       mov        w8 ,w0
                 2a
       14001ac44 1f  01  00       cmp        w8 ,#0x0
                 71
       14001ac48 00  02  00       b.eq       LAB_14001ac88
                 54
       14001ac4c 04  00  80       mov        x4 ,#0x0
                 d2
       14001ac50 03  00  80       mov        x3 ,#0x0
                 d2
       14001ac54 e2  01  80       mov        w2 ,#0xf
                 52
       14001ac58 68  05  00       adrp       x8 ,0x1400c9000
                 f0
       14001ac5c 01  c1  00       add        x1 ,x8 ,#0x30
                 91
       14001ac60 e0  03  40       ldr        x0 ,[sp ]=> local_40
                 f9
       14001ac64 a8  05  00       adrp       x8 ,0x1400d1000
                 f0
       14001ac68 08  11  40       ldr        x8 ,[x8 , #offset  -> KERNEL32.DLL::WriteConsoleA ] = 000d175a
                 f9
       14001ac6c 00  01  3f       blr        x8 => KERNEL32.DLL::WriteConsoleA
                 d6
       14001ac70 20  00  80       mov        w0 ,#0x1
                 52
       14001ac74 a8  05  00       adrp       x8 ,0x1400d1000
                 f0
       14001ac78 08  09  40       ldr        x8 ,[x8 , #offset  -> KERNEL32.DLL::ExitProcess ]   = 000d173c
                 f9
       14001ac7c 00  01  3f       blr        x8 => KERNEL32.DLL::ExitProcess
                 d6
At 0x14001ac3c we have a call to IsDebuggerPresent WinAPI function that checks for the value of PEB‘s structure field BeingDebugged of 1 BYTE length and writes the result to lower 32 bits of X8 register (W8). It then checks if the value returned is 0 (cmp w8, #0x0), and if it is (no debugger present), it jumps to LAB_14001ac88, otherwise it falls through, outputs something to the console with call to WriteConsoleA and exits (ExitProcess). This is another common technique deployed to make our dynamic analysis harder.
The interesting part is LAB_14001ac88 as it is the infinite loop code:
                         LAB_14001ac88
   14001ac88 28  00  80       mov        w8 ,#0x1
             52
   14001ac8c 1f  01  00       cmp        w8 ,#0x0
             71
   14001ac90 40  00  00       b.eq       LAB_14001ac98
             54
   14001ac94 fd  ff  ff       b          LAB_14001ac88
             17
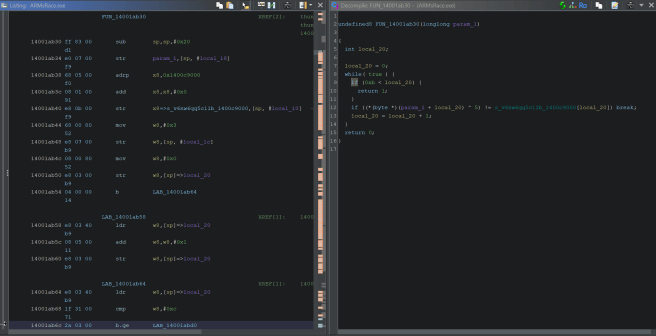
So we can safely assume that some in-memory patching will be needed in order to bypass it and jump to LAB_14001ac98 where the real fun starts as it ultimately leads to the function FUN_14001ab30 that does some XORing and compares the input to the predefined string that holds our flag:
So far, so good. As we have exhausted our static analysis possibilities, it is time for some dynamic work. Let’s fire up WinDbg.
It would be handy to place first breakpoint to the start of the main, but how do we do that? Well, as Ghidra has already told us that the main starts at the offset of 0x1abe0 from the image base (0x14000000), we have to calculate where this address is when image is loaded into memory. WinDbg’s list modules command (lm) comes handy for that:

Now that we know that 0x7ff699fe000 is the image base address, if we add 0x1abe0, we get 0x7ff699ffabe0 and that is the start of the main function where we can put our first breakpoint with bp. Now, remember that nasty anti-debugging routine that wants to prevent us acquiring that flag? Let’s use one cool feature of WinDbg called pseudo registers, and one in particular that points to the start of PEB structure called peb. You can list the entire structure with !peb command and check for all particularities of your running process:
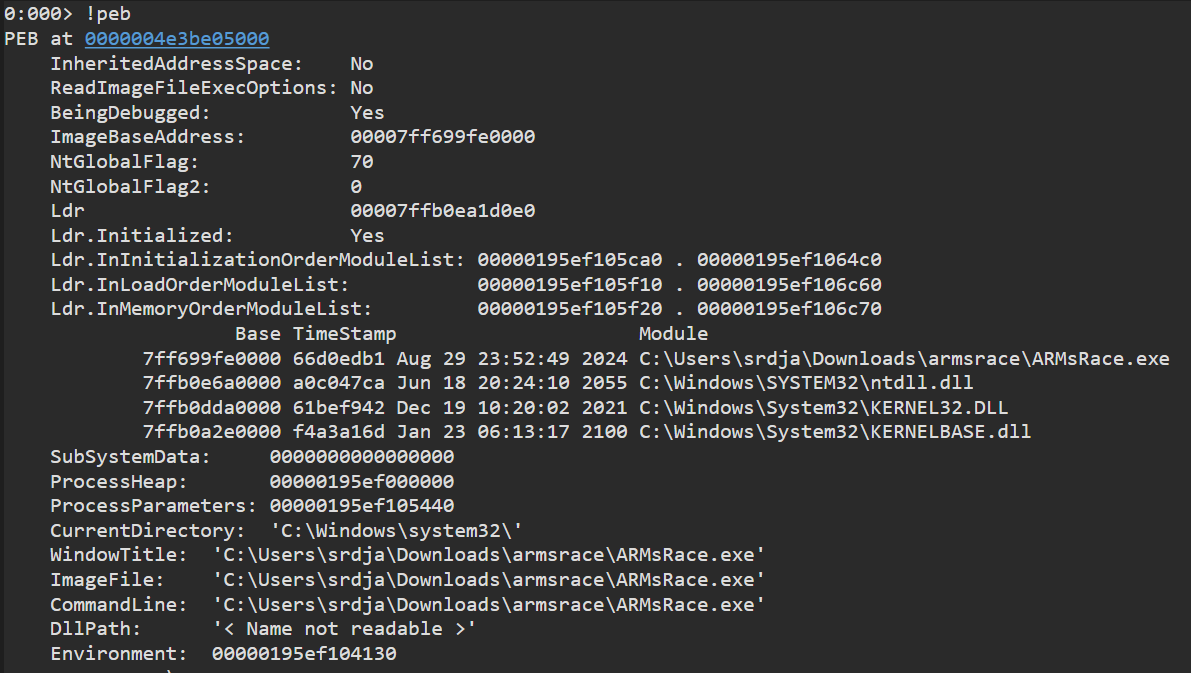
We can see BeingDebugged field that we’re interested in. Let’s disable that check with eb $peb+0x2 0x0 (write null byte as the field value):

That will allow us to continue with the execution to the infinite loop. This is how it looks in debugger:
00007ff6`99ffac88 28008052 mov     w8, #1
00007ff6`99ffac8c 1f010071 cmp     w8, #0
00007ff6`99ffac90 40000054 beq     00007FF699FFAC98
00007ff6`99ffac94 fdffff17 b       00007FF699FFAC88
Instruction at 0x7ff699ffac88 is an ideal candidate for in-memory patching, so let’s put a breakpoint there and work it a bit. What we want is to satisfy the condition at 0x7ff699ffac8c so that we can jump to 0x7ff699ffac98. In other words, we have to make sure that the value in w8 is 0. But first, we need to know the opcode for mov instruction and its operands (mov w8, #0) so that we can replace the current instruction with the new one.
For this task, we’re going to use pwntools as it provides elegant way to produce hex representation of AArch64 assembly instruction that we need:
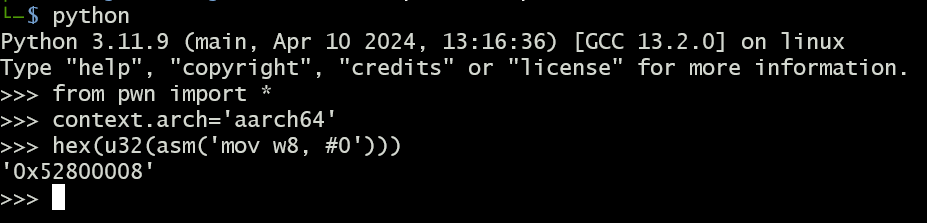
and there we have it. We can now patch the instruction with ed 0x7ff699ffac88 0x52800008 and voilla! Further execution will take us straight into that XORing shenanigans beginning at 0x7ff699ffab34 where we want to put our third breakpoint. Now we’re expected to provide the secret in order to get the flag. As we don’t have the slightest clue what that might be, let’s stick with couple of good old 0x41s:

Here is the function listing:
00007ff6`99ffab30 ff8300d1 sub     sp, sp, #0x20
00007ff6`99ffab34 e00700f9 str     x0, [sp, #8]
00007ff6`99ffab38 680500f0 adrp    x8, 00007FF69A0A9000
00007ff6`99ffab3c 08010091 add     x8, x8, #0
00007ff6`99ffab40 e80b00f9 str     x8, [sp, #0x10]
00007ff6`99ffab44 68008052 mov     w8, #3
00007ff6`99ffab48 e80700b9 str     w8, [sp, #4]
00007ff6`99ffab4c 08008052 mov     w8, #0
00007ff6`99ffab50 e80300b9 str     w8, [sp]
00007ff6`99ffab54 04000014 b       00007FF699FFAB64
00007ff6`99ffab58 e80340b9 ldr     w8, [sp]
00007ff6`99ffab5c 08050011 add     w8, w8, #1
00007ff6`99ffab60 e80300b9 str     w8, [sp]
00007ff6`99ffab64 e80340b9 ldr     w8, [sp]
00007ff6`99ffab68 1f310071 cmp     w8, #0xC
00007ff6`99ffab6c 2a030054 bge     00007FF699FFABD0
00007ff6`99ffab70 e80340b9 ldr     w8, [sp]
00007ff6`99ffab74 087d4093 sxtw    x8, w8
00007ff6`99ffab78 290080d2 mov     x9, #1
00007ff6`99ffab7c 097d099b mul     x9, x8, x9
00007ff6`99ffab80 e80740f9 ldr     x8, [sp, #8]
00007ff6`99ffab84 0801098b add     x8, x8, x9
00007ff6`99ffab88 0801c039 ldrsb   w8, [x8]
00007ff6`99ffab8c e803082a mov     w8, w8
00007ff6`99ffab90 e90740b9 ldr     w9, [sp, #4]
00007ff6`99ffab94 29090011 add     w9, w9, #2
00007ff6`99ffab98 0801094a eor     w8, w8, w9
00007ff6`99ffab9c e90340b9 ldr     w9, [sp]
00007ff6`99ffaba0 297d4093 sxtw    x9, w9
00007ff6`99ffaba4 2a0080d2 mov     x10, #1
00007ff6`99ffaba8 2a7d0a9b mul     x10, x9, x10
00007ff6`99ffabac e90b40f9 ldr     x9, [sp, #0x10]
00007ff6`99ffabb0 29010a8b add     x9, x9, x10
00007ff6`99ffabb4 2901c039 ldrsb   w9, [x9]
00007ff6`99ffabb8 e903092a mov     w9, w9
00007ff6`99ffabbc 1f01096b cmp     w8, w9
00007ff6`99ffabc0 60000054 beq     00007FF699FFABCC
00007ff6`99ffabc4 00008052 mov     w0, #0
00007ff6`99ffabc8 03000014 b       00007FF699FFABD4
00007ff6`99ffabcc e3ffff17 b       00007FF699FFAB58
00007ff6`99ffabd0 20008052 mov     w0, #1
00007ff6`99ffabd4 ff830091 add     sp, sp, #0x20
00007ff6`99ffabd8 c0035fd6 ret
A lot to grasp but bear with me. Instruction at 0x7ff699ffab38 loads a pointer to 0x7ff69a0a9000 in the register x8 and immediately catches our attention. Let’s observe the contents of that memory location with da 0x7ff69a0a9000:

Remember that obfuscated string that was spilled when we were searching for interesting ones at the beginning of our analysis? It seems that it is, in fact, our encoded secret that will be compared, byte by byte with our input buffer pointed to by the address that gets loaded into x8 register with the instruction ldr x8, [sp, #8] at 0x7ff6`99ffab80:

Let’s take a look at the following two instructions:
00007ff6`99ffab94 29090011 add     w9, w9, #2
00007ff6`99ffab98 0801094a eor     w8, w8, w9
Right before the first instruction gets executed, w9 register holds a value of 0x3. With the add w9, w9, #2, it gets increased to 0x5 and this is our key that the next instruction uses for XOR operation (eor in ARM assembly) as it decodes each byte of obfuscated secret and compares it with our input buffer. As our input is “AAAAAAAA”, execution ends as the first character of secret is NOT 0x41. What we can do at this point is to either bruteforce all chars from ASCII charset, which is a bit lengthy process involving lots of debugger restarts (yes, I know I could use TTD), OR, we could just XOR each letter of our secret with 0x5 and get the flag. Yes, you guessed it right, simple python is getting the job done:
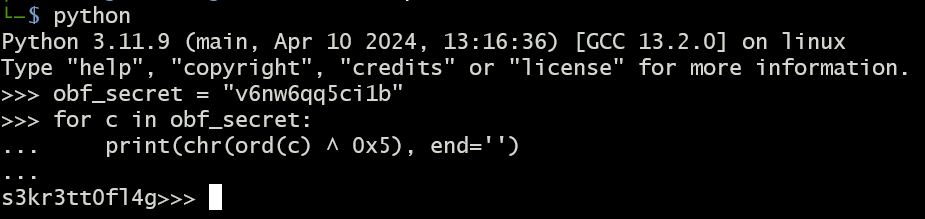
Flag: s3kr3tt0fl4g
Keep cool, happy reversing and see you in the next episode.
